05 Feb 2016 | web: Sam Clifford | github: samclifford
tags:
Jekyll
|
This page is hosted on GitHub Pages, which means if you want to contribute to it you’ll need a GitHub account. Once you’ve got one, you can either clone or download our repository add write new posts with R Markdown. The easiest way to do this is to use RStudio (especially if you’re writing R snippets) and go to File \ New File \ R Markdown…
Use the following template as your markdown header and save as an .Rmd file with a title of the form YYYY-MM-DD-username-filename.Rmd; this will ensure that even if two people write the same file on the same day that they do not overwrite each other’s posts on committing.
Read more →
05 Feb 2016 | web: Sam Clifford | github: samclifford
tags:
r,
dplyr,
tidyr
|
This snippet was motivated by a hack that Marcela Cespedes presented to BRAG on 4 February 2016. Sometimes a longitudinal data set, e.g. patient information, doesn’t have all subjects observed at all time points. Here’s a way of generating an index of patient IDs corresponding to non-missing response values which may be useful for analysis with JAGS.
We’ll make use of tidyr and dplyr to manipulate some simulated data.
Read more →
27 Jan 2016 | web: Sam Clifford | github: samclifford
tags:
r,
dplyr,
ggplot2
|
Description
Sometimes in time series you have a set of states for which you may spend a certain amount of time before switching to another state or returning to a previous one (e.g. whether a student is indoors at school, outdoors at school, commuting, indoors at home, etc.).
A straight up factor to numeric conversion won’t work, because we want to assume that returning to a previous value.
library(ggplot2)
library(dplyr)
First we’re going to simulate some data that behaves the way we discussed above.
Read more →
25 Jan 2016 | web: Sam Clifford | github: samclifford
tags:
r,
ggplot2,
visualisation
|
Assuming you’ve got RStudio installed and open, we will install some extra packages that extend the functionality of R.
install.packages(c("ggplot2", "openair"))

library(ggplot2)
library(openair)
The above code blocks will install and load the following libraries (and their dependencies):
ggplot2, a powerful plotting library that uses a grammar of graphicsopenair, a collection of useful tools for analysing air quality data
The openair library contains a dataset called mydata, which we will use to demonstrate the use of R. This data was collected from 1 January 1998 to 23 June 2005 at the Marylebone (London) air quality monitoring station.
We’ll use the data command to tell R to load the dataset and use the ggplot2 library to visualise our data.
data(mydata)
ggplot(data=mydata, aes(x=date, y=pm10)) + geom_line()
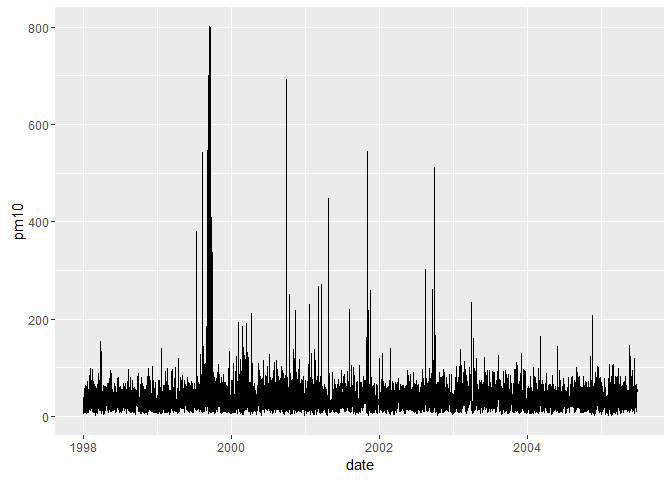
Time series of PM10 data
You can find out more about the ggplot2 package at http://docs.ggplot2.org/
Read more →
23 Jan 2016 | web: Ben Fitzpatrick | github: brfitzpatrick
tags: no tags |
Description
Creates a rainbow coloured scatterplot with existing R functions that do the same (i.e. an entirely pointless example function).
Code Snippet
Your code snippet itself:
PL.f <- function(x = rnorm(200), y = rnorm(200)){

  # Creates scatter plot of two vectors colouring points by element order

  if (!(length(x) == length(y))){
    stop('please supply numeric vectors of the same length to arguments x and y')
  }
  col.v = rainbow(length(x))
  plot(x, y, col = col.v)
}
If you indent with spaces alone what you see is what you should get on the webpage.
Maybe we should recommend a style guide for code snippets e.g. Google’s R Style Guide
Images
How should we do these - it’s bad practise to have files that can’t be merged in a Git repository I believe so we should host the images somewhere else?
tierneyn suggests:
The images problem could be sovled by adding a folder called “assets”, and then we link to that folder using liquid syntax:
something like http://bragqut.github.io/assets/imagename.jpg
Read more →

