Small intro
25 Jan 2016 | web: Sam Clifford | github: samcliffordtags: r, ggplot2, visualisation |

Assuming you’ve got RStudio installed and open, we will install some extra packages that extend the functionality of R.
install.packages(c("ggplot2", "openair"))

library(ggplot2)
library(openair)
The above code blocks will install and load the following libraries (and their dependencies):
ggplot2, a powerful plotting library that uses a grammar of graphicsopenair, a collection of useful tools for analysing air quality data
The openair library contains a dataset called mydata, which we will use to demonstrate the use of R. This data was collected from 1 January 1998 to 23 June 2005 at the Marylebone (London) air quality monitoring station.
We’ll use the data command to tell R to load the dataset and use the ggplot2 library to visualise our data.
data(mydata)
ggplot(data=mydata, aes(x=date, y=pm10)) + geom_line()
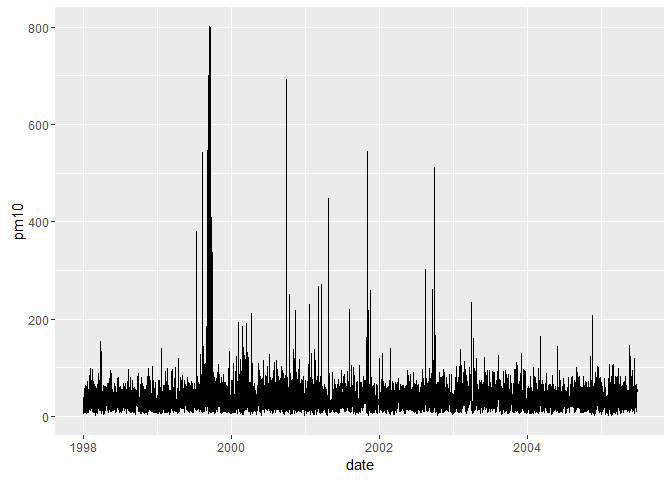
Time series of PM10 data
You can find out more about the ggplot2 package at http://docs.ggplot2.org/
comments powered by Disqus