What the shist()?
24 Feb 2016 | web: Miles McBain | github: milesmcbaintags: r, visualisation |

More than cheap wordplay
I love hist(). It is both a go to plot for data exploration and a really simple way to dazzle users of Microsoft Excel. base::hist() is fast, both to type and in execution, but its downfall is you end up using it many times in a row while you fumble for the right bin width. All that fumbling can kill the magic.
Enter shist() the shifting-histogram… or something… it sounded cool. shist() is a histogram I built from Hadley’s ggvis that lets you interactively select the bin width while it updates the frequencies in real time. This means you only need to plot at most twice: One for shape, two for pretty.
It is a very simple package with simple code, so hopefully ‘it just works’. Maybe I should call it iShist()? I digress. Here is how you use it:
library(shist)
data(trees)
shist(trees$Girth)
#Produces a shifting histogram with a slider to select bin width.
#The bin width increment step is automatically is selected by an algorithm.
#It can be overidden:
shist(trees$Girth, bin_step = 1)
And this is kind of what it looks like, since the real deal is far more than a static image: 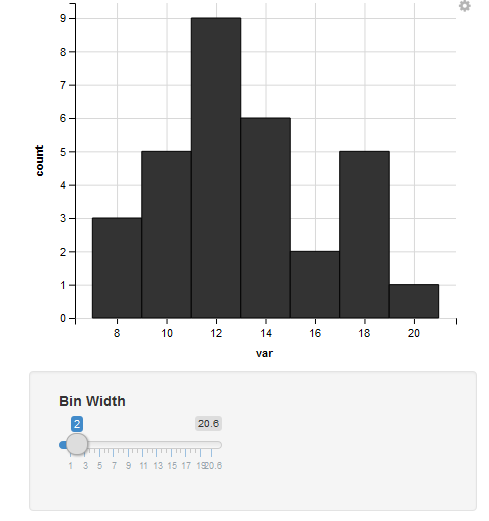
shist() is available at https://github.com/MilesMcBain/shist